LCIC Land Inventory Map
User Instructions
How to navigate and use the LCIC Land Inventory Mapping System
Developed over 2 years with the support of researchers at Selkirk Innovates, and in partnership with TruGIS Web & Geospatial Services, this map is used to facilitate effective planning and management of industrial, commercial and agricultural lands.
This guide will show you how to make the most of the system’s features. Although your specific needs may be unique, having a solid grasp of the basics will help you navigate the map with ease and set you on the right path.
Initial View
The initial map view will display the entire region covered by the parcel map

Navigation

Left click and drag to move around the map
Zoom in and out using the mouse wheel (alternatively use the ‘+-’)
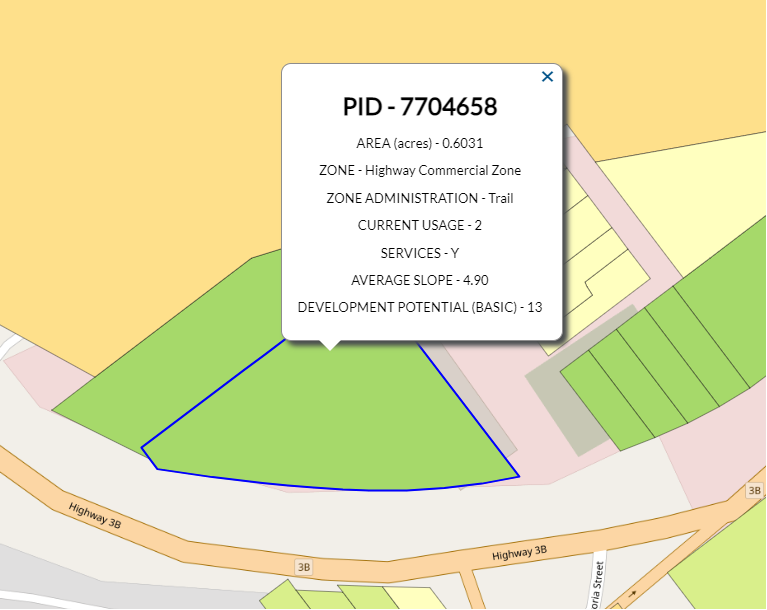
Click on a parcel to view its information popup:
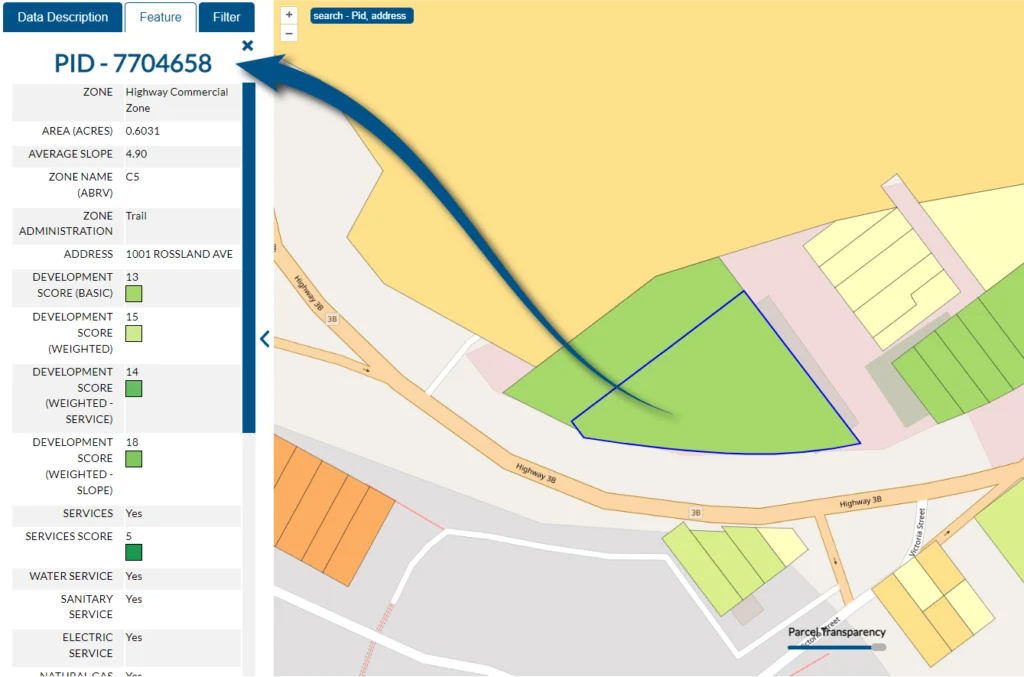
For more detail on a parcel, double click to open its details in the information pane on the left:
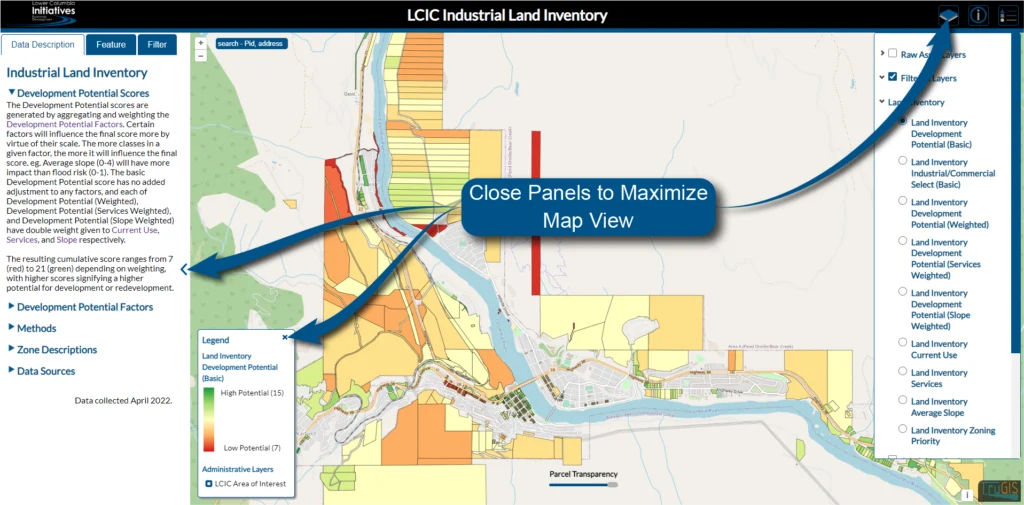
Maximise your view of the map by closing the legend, information, pane, and/or the layers panel.
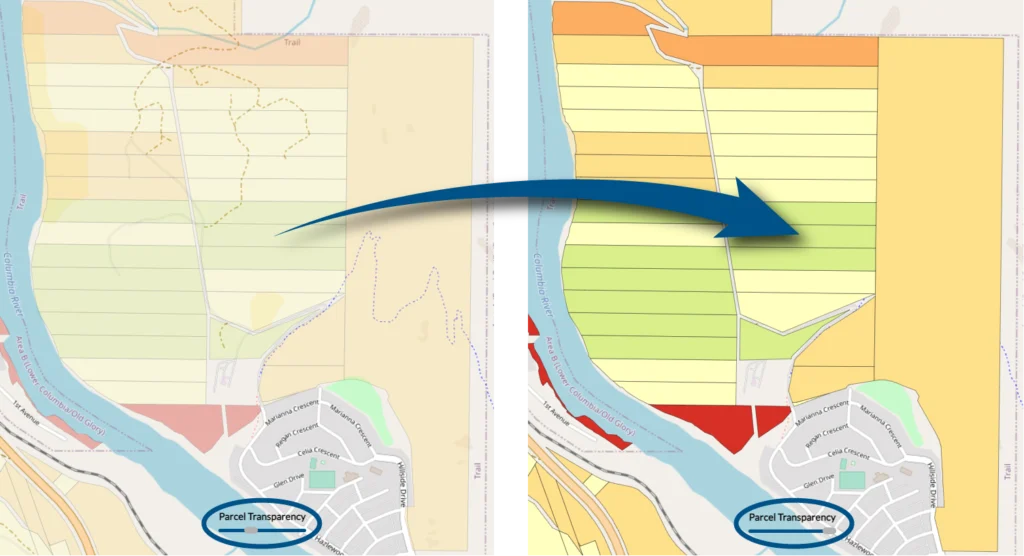
Transparency slider
The transparency slider at the bottom is used to increase or decrease the visibility of the parcel background colors. Decrease transparency to see more detail from the underlying basemap or increase transparency have a clear view of the parcel’s perimeter/area
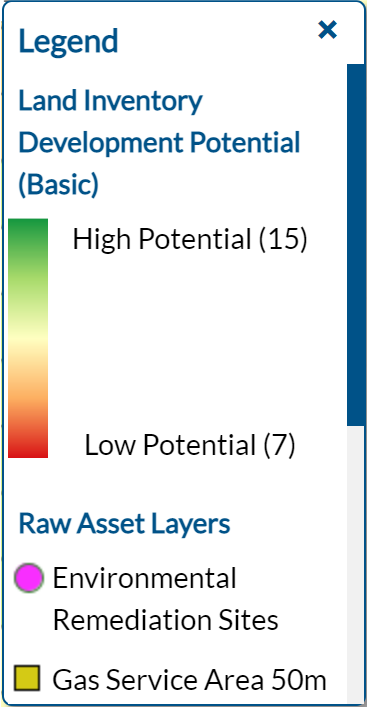
Legend / legend button
The legend is dynamic and will display information based on which layers (from the layer panel) are selected. You may close the legend at any time using the ‘x’ close button or clicking the legend button on the top-right. To open the legend after closing it, click the legend button again.
Info pane
The information pane is where important details about the map are displayed. What’s displayed will change depending on what you’re working on. The info pane consists of 3 tabs:
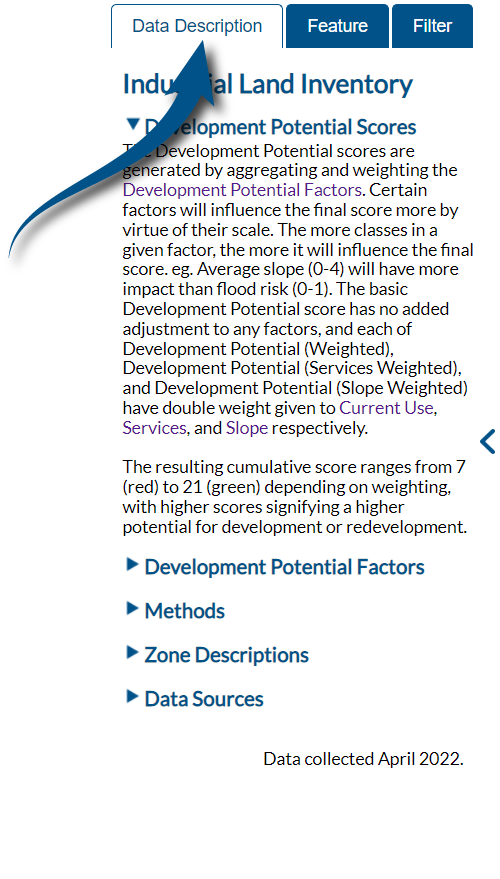
1. Data description tab
This tab is active when first opening the map. It gives important information about the map and its data. These include Development Potential Scores, Development Potential Factors, Methods, Zone Descriptions, and Data Sources.
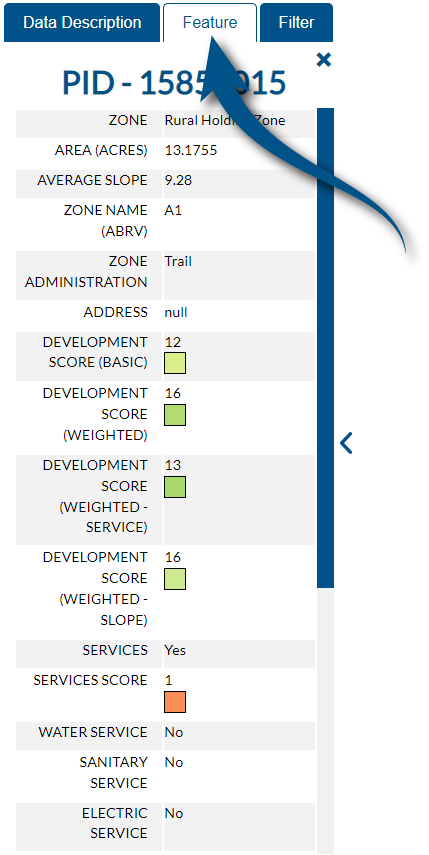
2. Feature Tab
This is where detailed information about each parcel will be displayed. Double clicking any parcel will display its details.
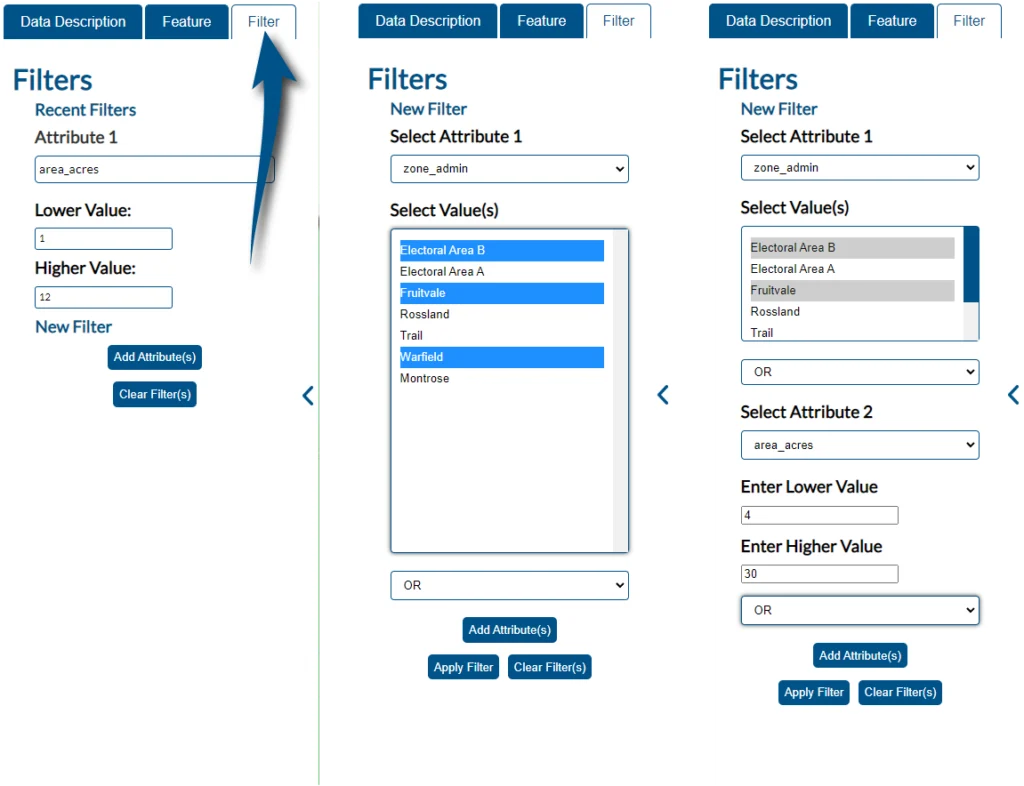
3. Filter Tab
Use this to create filters to display specific parcels according to your chosen criteria. Clicking the ‘Add attribute’ button will allow you to add an attribute to the filter. After selecting an attribute, select from the list of values it produces. Multiple values may be selected by holding ‘ctrl’ while selecting. It’s possible to filter by more than one attribute by first choosing whether you want it to include parcels that meet “either” criteria by choosing “OR” or only parcels which meet “both” criteria by choosing “AND”. Then click the ‘Add attribute’ button to add a second attribute and repeat the previous steps. Any number of attributes may be added. Now click the ‘Apply’ button to display your choices on the map. This filtered layer will also be added to the layers panel on the right. Multiple filtered layers can be added at a time, and can be switched on or off in the layers pane on the right. Remove your filtered layers by clicking the ‘Clear Filters’ button.
Layer Panel
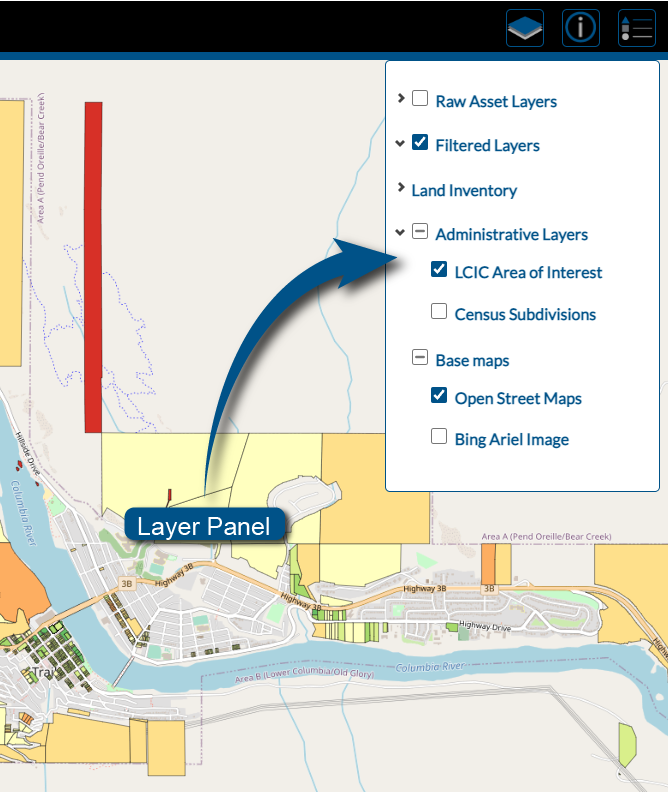
The layer panel allows you to control what is being displayed on the map at any given time. The legend will dynamically change based on your selection. It consists of 5 sections:
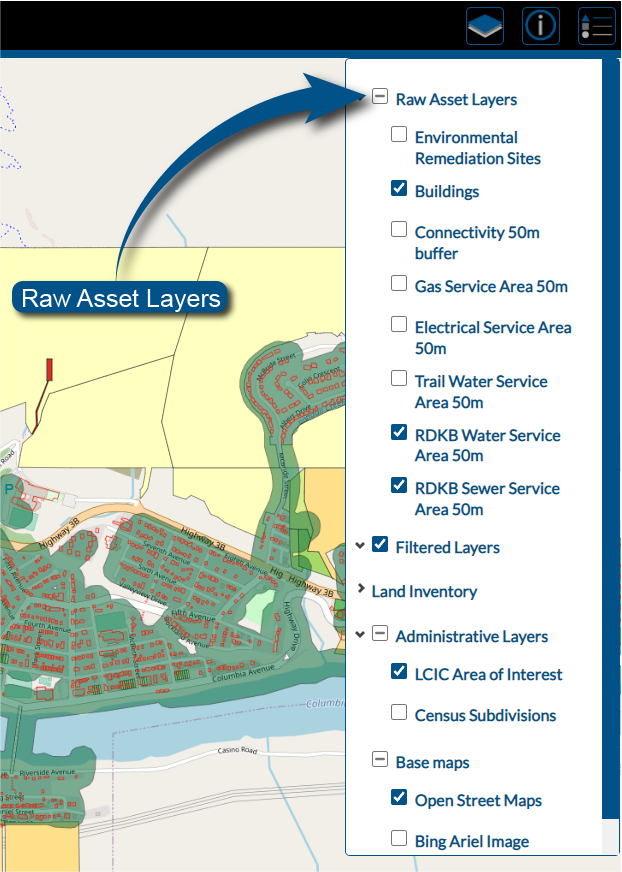
1. Raw asset layers (see info pane for details specific to each layer)
*Note: Some asset layers may not be present on all versions of the map
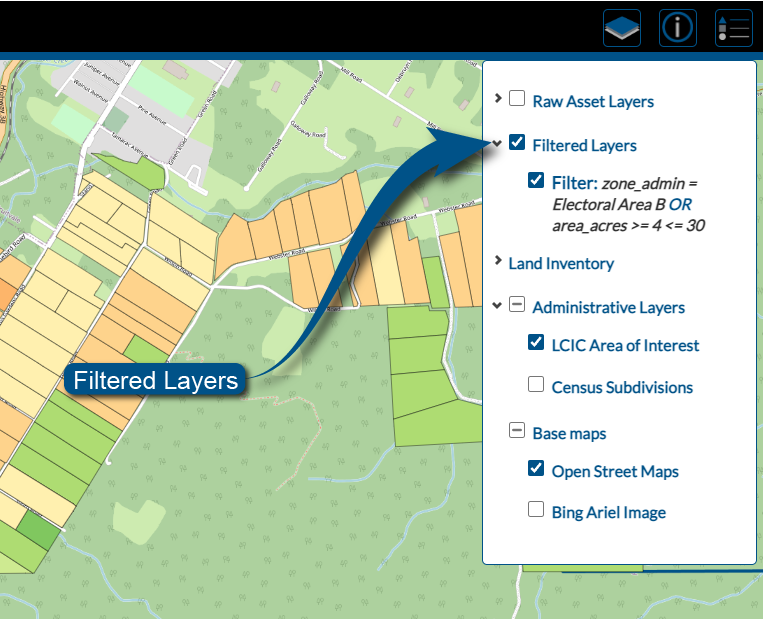
2. Filtered Layers
Any filters you apply will be identified here. Turn filtered layers on/off using the check box.
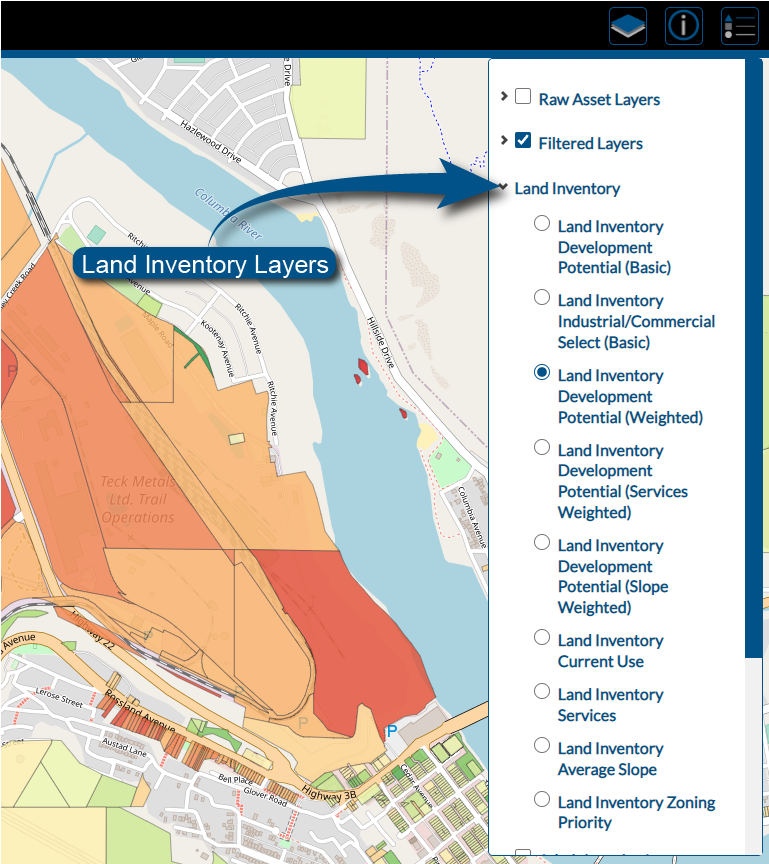
3. Land inventory
This layer allows you to view parcels according to a given criteria. The Development Potential scores are generated by aggregating and weighting the Development Potential Factors. Certain factors will influence the final score more by virtue of their scale. The more classes in a given factor, the more it will influence the final score. The resulting cumulative score ranges from 7 (red) to 21 (green) depending on weighting, with higher scores signifying a higher potential for development or redevelopment (see info pane for details specific to each layer).
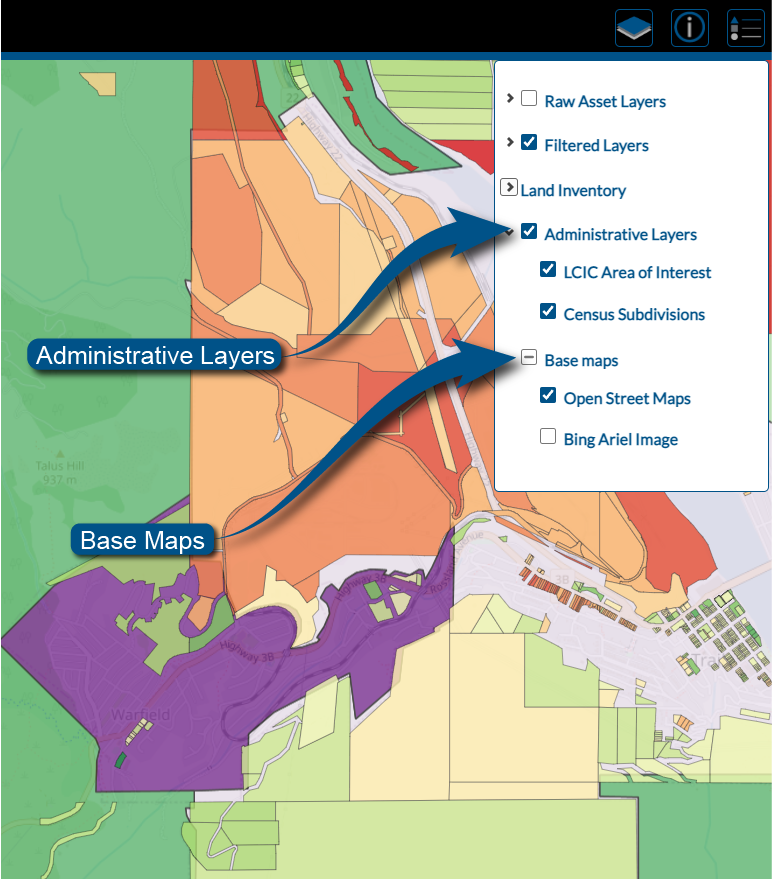
4. Administrative layers
Select to display / hide the perimeter of the LCIC’s area of interest and/or the census subdivisions.
5. Basemaps
Change or hide a specific base map. Switch between ‘Open Street Maps’ or a Bing Aerial image map. Alternatively remove the basemap completely to focus exclusively on parcel data.
Search bar
Search by entering either a known PID# or physical address
*Note: Not all parcels have a physical address. A limited number of parcels are missing a PID.